Archive for the ‘Featured’ Category

FOSR 2019 Summer E. coli Results through 06.27.2019

Here are this week’s quantitative E. coli concentration results from the 15 public access and recreational use sites located on the Main-stem, North Fork and South Fork of the Shenandoah River, and the Opequon Creek being tested by the Friends of the Shenandoah River.  The water samples were collected on Thursday, June 27.

In a freshwater system, the data represents a snapshot of the water quality on the date, time, and under the conditions that the water sample was collected.  E. coli levels are fluid, meaning that the concentration of E. coli changes.   Such changes are influenced by many factors, including;

  • changes in the volume of flow caused by
    • local and regional rain events that flush contaminants from the land surfaces into the streams and rivers
    • water withdrawal and drought
  • runoff from urban, suburban, rural and agriculture lands
  • illicit discharge, failing septic systems, contaminated groundwater
  • wildlife, livestock, pets, and humans

Last night (Thursday, June 27) thunderstorms, with at times heavy rains, passed through Frederick, Clarke, Warren, and Shenandoah counties.   This morning, Friday June 28, I collected water samples from the following locations to see what, if any, effect the rain may have had on the E. coli concentrations at these sites:

  • Opequon Creek (FCOC)
  • Main-stem of the Shenandoah River in Clarke County (FC01, FC05, and FC08)
  • Main-stem of the Shenandoah River Warren (FW35 and FW 35 Mid)  – did not observe evidence of rain at this site, such as standing puddles of water, yet surfaces, dampness
  • Manassas Run (FW36) in Warren County –  did not observe evidence of rain at this site, such as standing puddles of water, yet surfaces, dampness
  • South Fork of the Shenandoah River in Warren County (FW14)
  • North Fork of the Shenandoah River in Shenandoah County (FSDR and FSSP)

The E. coli concentration results for the water samples collected today will be posted tomorrow morning.

FOSR 2019 Summer Quantitative E. coli Concentration Results through 06.27.2019

FOSR’s 2019 Summer E. coli Results through 06.20.2019

Here are this week’s quantitative E. coli concentration results from the 15 public access and recreational use sites on the Main-stem, North Fork, and South Fork of the Shenandoah River and Opequon Creek.

It is important to remember that these data points represent the E. coli levels at the specific site location, on the date, time, and conditions when the water sample was collected.  Changes in the weather, runoff, confluence with other streams, can cause E. coli levels to change.

FOSR 2019 Summer Quantitative E. coli Concentration Results through 06.20.2019

FOSR’s 2019 Summer E. coli Results through 06.12.2019

Here are this week’s quantitative E. coli concentration results from the 15 public access and recreational use sites on the Main-stem, North Fork, and South Fork of the Shenandoah River.

It is important to remember that these data points represent the E. coli levels at the specific site location, on the date, time, and conditions when the water sample was collected.  Changes in weather, such as the rain event last night, can cause E. coli levels to change.

FOSR 2019 Summer Quantitative E. coli Concentration Results through 06.12.2019


FOSR’s 2018 Summer E. coli Testing Project Report Summary

In response to the public concerns about exposure to reported increased bacteria levels in the Shenandoah River, the FOSR launched a project that began in 2017 to test the Escherichia coli bacteria (E. coli) levels in the Shenandoah River at public access and recreational areas. Initially, the project started with three sites selected on the Main Stem of the Shenandoah River in Clarke County, Virginia that were tested from May through August. The FOSR implemented the same once a week testing methodology used by the Virginia Department of Health for the public coastal beaches of Virginia. The goal of FOSR’s summer E. coli testing project is to provide frequent, real-time accredited E. coli concentration results for river recreation users to make their own informed decision about potential associated health risks when recreating in the areas of the river tested.

Thanks to generous funding received to continue the project, in 2018 the FOSR expanded its E. coli testing project to include a total of fifteen sites located on the North Fork, South Fork, Main Stem of the Shenandoah River and Opequon Creek. The project was launched the first week of May and continued through the last week of September.

FOSR 2018 Summer E. coli Testing Project Report Summary

30th Year Being a Champion for the Shenandoah River Watershed

The Friends of the Shenandoah River’s (FOSR) long-term volunteer citizen-scientist water-quality monitoring program of the Shenandoah River and its tributaries is in its 30th year. The success of this program would not be possible without the dedication of our citizen scientist volunteer water-quality monitors that go out in all types of challenging conditions to perform their water-quality monitoring duties.  In addition, we would like to thank those individuals, organizations, and local and state agencies that have continued to support us throughout the years.
 
The value of the long-term database that the FOSR has been compiling over the past three decades increases with the length of the record and is a tool crucial to understanding the water quality impairments and improvements of the Shenandoah River watershed over the short term as well as the long term.
 
The first FOSR’s routine water-quality monitoring will be Friday, January 11, 2019. The second date will be Friday, February 8, 2019. If you see one of our volunteers collecting a water sample, please thank them for their continued service.

2015 Mid-Atlantic Volunteer Conference – Shenandoah University

Bridging the Water Quality Data Gap

The Friends of the Shenandoah River is pleased to announce it is one of the hosts of 2015 Mid-Atlantic Volunteer Monitoring Conference on August 6-8 at Shenandoah University in Winchester, Virginia.

11080645_433789316781694_8836620194275976748_oA chance to share and learn form other monitors and programs, this conference will highlight citizen volunteer water monitoring efforts from Delaware, Maryland, Pennsylvania, Virginia, and West Virginia. A variety of special events and breakout sessions have been planned as well. There is an early bird canoe trip scheduled on Thursday, and on Friday evening enjoy screenings at the first biennial Mid-Atlantic Volunteer Monitoring Film Festival.

The director of Virginia’s Department of Environmental Quality, Mr. David Paylor; and Nickolas DiPasquale, Director of the Chesapeake Bay Program are the keynote speakers of the conference.

The importance of volunteer water quality monitoring groups has grown significantly in this day of incessant budget cuts, and the rise of pollution reduction programs. Representatives from state and local government will talk about how helpful our groups have been to them

We are excited that the Saturday program includes two tours of our own water quality laboratory at Shenandoah University named in honor or Fran Endicott . Our local partner, The Downstream Project, will be showing a couple of short videos and sharing the successes of the C Spout Run partnership in the habitat restoration of Clarke County’s Spout Run.

For people not familiar with karst geology and its impact on water quality (certainly not us from the Shenandoah Valley!), there will be a tour of one of our karst cave formations and a discussion of karst and it’s role in our regional history.

So please mark your calendars for those dates, August 6 – 8 and register by July 23 to ensure you have a space for the conference! Three local hotels are offering reduced rates.  Details about reserving a room and other conference information is available on Facebook.

Download Conference Flier and Agenda

A Reference Stream for the Karst Area of Shenandoah Valley

by Wayne Webb

In Virginia, a stream is listed as impaired if it fails to meet the State water quality standards that support the designated uses of all of Virginia’s rivers and streams. If a stream fails to meet a designated use and its associated water quality standard, then the State develops a total maximum daily load (TMDL) for the pollutant that will bring the stream into compliance with water quality standards. One of these designated uses for all of Virginia’s streams is the support of a healthy and diverse population of aquatic life. When streams do not support this designation, a stressor analysis is performed during the TMDL development process.  Once the primary stressor(s) of the biological community is identified, a TMDL is developed for that particular pollutant.  In cases where a numeric water quality criterion does not exist, the stream of interest is compared to a “healthy” reference stream to determine a tolerable pollutant load that will not compromise the biological community.

Other considerations are defined by the use of the water body and can include numeric State-wide water quality standards.  For fresh water contact recreation (wading, swimming, fishing), for example, E.coli bacteria densities are to be less than a prescribed concentration for a defined frequency.

Unfortunately, there are no streams in the karst area of the Shenandoah River valley that DEQ has used as a reference stream for various stressors of the biological community identified in streams throughout the region. And there is a need for at least one or more reference streams because of the large number of streams in the karst area of the Valley that are listed as impaired.

Karst geology imparts a unique hydrology that has a major impact on stream flow and water quality. In the Shenandoah Valley most people live in karst areas and most farming occurs in the karst areas.  Consequently the karst streams receive a strong environmental imprint caused by land use and land cover that is substantially different from mountain streams with low human populations and little or no farming.  However, in the Shenandoah Valley mountain streams are being used as reference streams for karst streams. Comparing karst streams to non karst streams is like comparing apples and oranges. A reference stream should exhibit the qualities that one would expect to find in a stream in a similar environment that is not polluted.

Defining what the standards should be for a reference stream is a challenge.  For many of the karst streams in the Valley the impairments are E. coli bacteria

page brook 2

Page Brook in flood at Rt. 340, October 30, 2012, 10:00 am. White color is weaver soil suspended from the bottom during Hurricane Sandy.

and sediment. Sediment is usually listed as the cause of the lack of benthic diversity. E coli exceedances are typically caused by cattle waste deposited directly in the stream, direct discharge of untreated sewage or wild animal waste, and runoff of manure from pasture and cropland.2014 Monitoring Calendar

The karst streams of the Valley are in sediment that in Clarke County is called Weaver soil. Weaver soil is the result of deposition by precipitation of calcium carbonate dissolved from limestone bedrock and formed when ground water is warmed as it flows from springs into the stream and oxygenated as it flows over riffles and waterfalls.  Ground water comprises more than 90% of all the water that is contributed directly to karst streams because of the permeability of fractured limestone. Thus a stream from which cattle are excluded and which does not receive untreated sewage should represent an example of a stream that is not polluted and could be considered for “reference” stream designation for benthic invertebrates.

Beginning in 1997 the Clarke County Planning Department began a concerted effort to have livestock excluded from the entire 8.87 mile length of Page Brook because it makes up a substantial part of the recharge zone for Prospect Hill Spring. (This spring is the potable water supply source for Millwood, Boyce, Waterloo and White Post ) That effort continues today and is nearing completion. Recent efforts supported by the Lord Fairfax Soil and Water Conservation District, NRCS and local land owners include installing off-stream watering facilities for cattle and stream exclusion.  Approximately 90% of the length of Page Brook is now protected from cattle access. There are only about 20 residences within 1000 feet of Page Brook and there are no known direct sewage discharges. . Based on existing conditions in the Page Brook watershed and recent improvements made to the stream including establishment of a considerable amount of livestock exclusion fencing, it is expected that Page Brook should soon be meeting the bacteria water quality standard under most conditions, ultimately leading to removal of its bacteria impairment in the next several years.

Although streams usually need time to recover after management practices are put into place, the benthic invertebrate communities in Page Brook could, in the future, represent what will be the indigenous benthic communities of a stream in the karst agricultural area of the Valley that has received the best available BMP technology.. Thus the invertebrate community of Page Brook could eventually be considered a reference community for the karst agricultural streams of the Valley.

There have been and continue to be evaluations of Page Brook that can contribute to a bench mark to which other streams can be compared.

During a period from 1995 to 1998 LeAnne E. Astin conducted an evaluation of the benthic invertebrates in the upstream portion of Page Brook west of VA Rt. 617. That work was reported in  Bioassessment of BMP Effectiveness in an Agriculturally Impacted Watershed in Clarke County, VA a Master of Science thesis submitted to George Mason University in 2000.

The Astin report contained three salient points. First, there are no reference streams in the karst area of the Valley.  Second, exclusion of cattle from the stream is necessary for E. Coli reduction. And third, exclusion is needed to improve benthic diversity.  Benthic diversity was noted to recover in a few 1000 feet down stream of the last cattle access.

page brook

Page Brook

Recently, as part of the Spout Run TMDL Clean-up Plan and improvement effort, the Piedmont Environmental Council is collecting benthic macro invertebrate samples at the mouth of Page Brook. The Friends of the Shenandoah River (FOSR) has collected and analyzed water samples for nutrients from Page Brook since 1997 at Route 617.  More recently, also as part of the Spout Run improvement efforts, FOSR is collecting water samples for nutrient and bacteriological analysis at the mouth of Page Brook.

The FOSR data show that the nitrate concentrations in Page Brook are less than 2 mg/l whereas most of the karst streams in the Valley have higher nitrate concentrations. Thus a repeat of the Astin study for the entire length of Page Brook and with the FOSR data there would be documentation of a karst stream to which other karst streams could be compared. Such a study could result in a dramatically improved basis for determining whether or not many streams rising in a karst geologic environment are in fact impaired and if so, what Best Management

Practices are needed to correct such impairments.


Stories Your FOSR Data Can Tell You

We encourage you to visit our map and data portal that will open with a map identifying all of the FOSR’s monitoring sites throughout the Shenandoah River watershed.  You will be able to click on the individual markers that will lead you to a link to obtain FOSR’s water-quality data for that site. The FOSR’s “Water Window” data portal provides unparalleled documentation of the evolving health of the Shenandoah River watershed.

The story from Clarke County is that if the trend in nitrate levels continues, the ground water in the karst areas of the county will contain nitrate concentrations that exceed the US EPA drinking water limit of 10 mg/l of nitrate as N in the latter part of this century or possibly in the next.   Most of us in the Shenandoah Valley live in the karst areas  and thus, in the future, many of  our rural wells could yield water containing high nitrate concentrations. The five streams FOSR has been monitoring for the past 18 years in Clarke County all show increasing low-flow nitrate concentrations of between 0.6 to 1.5 mg/l. (The Wheat Spring Branch record includes only the last 10 years.) a straight line projection of this  increase suggests that, if this trend continues, two streams could reach EPA’s drinking water limit of 10 mg/L before 2100:   Wheat Spring Branch FC32 and Dog Run FC06.  Chapel Run CF18 and Lewis Run FC03 are projected to reach 10 mg/L during 2100 to 2200. Spout Run FC02 and Page Brook FC09, a Spout Run tributary, are increasing more slowly and will not exceed 10mg/l till after 2300.

Untitled     
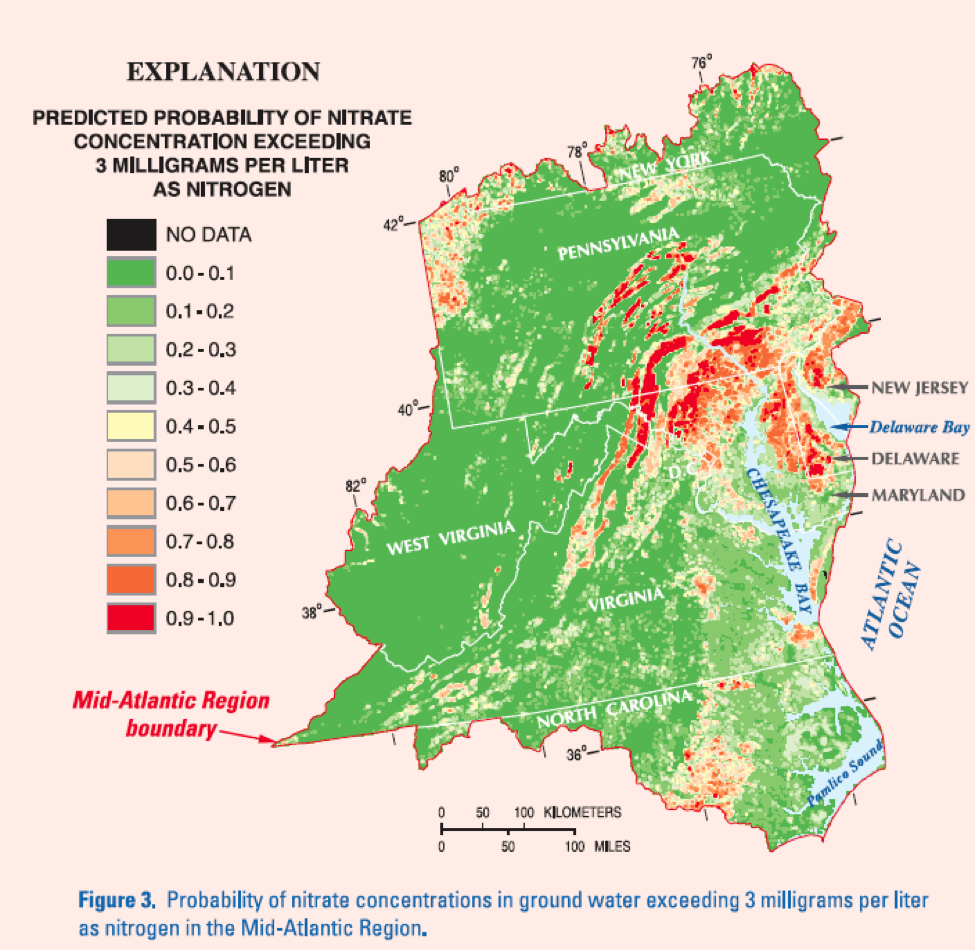
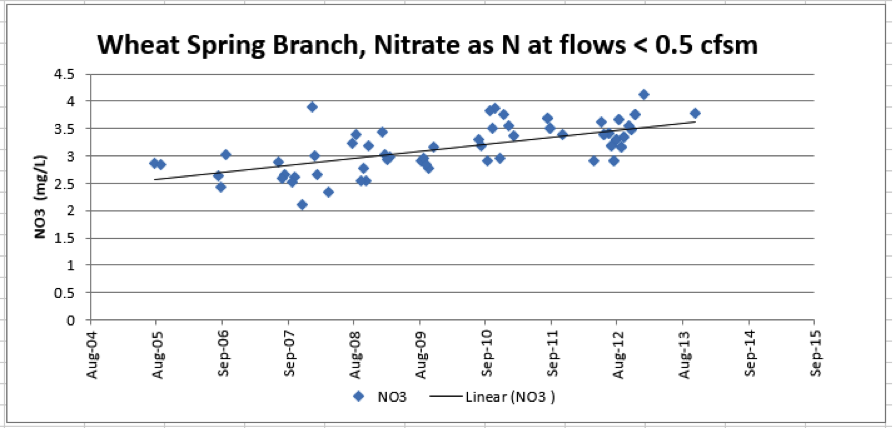
Low-flow stream nitrate concentrations are linked to groundwater concentrations.  FOSR’s recent analysis of springs showed that in general springs yield water with higher nitrate concentrations than the streams to which they  are tributary. For example Carter Hall Spring water contained 3.5 mg/L during a period when Spout Run contained a little less than 2.5 mg/L of nitrate. See www.fosr.org and “FOSR Report: Risks of biosolid fertilizer application on water quality.”

Ground water is the entire water supply of the streams during periods of low flow. (See http://pubs.usgs.gov/sir/2010/5112/ ) The definition of low flow for this report is when the flow of Spout Run at the gage is less than 0.5 cubic feet per second per square mile (cfsm) or 10.6 cubic feet per second (cfs). The gage flow records for USGS 01636316 SPOUT RUN AT RT 621 NEAR MILLWOOD, VA show that the discharge (flow) averaged no more than 0.5 cfsm 23% of the days during the 12-year period of record.

USGS Fact Sheet FS 2004-3067 published in 2005 shows that Clarke County karst areas have a very good chance of having 3 mg/L of nitrate in the ground water and about a 50% chance of having the EPA drinking water limit of 10mg/L in the ground water. Low-flow nitrate concentrations indicate the minimum concentration in the ground water. After water enters the stream, algae use nitrate to grow, thus reducing the nitrate concentrations in the water.  It’s possible that animal waste washing into streams could  increase nitrate concentration as flow increases. Dog Run, Lewis Run and Wheat Spring Branch increase in nitrate concentration as the flow increases. The other streams decrease in nitrate concentration as flow increases. However, there is no wash off when the flow is 0.5 cfsm or less.

written by Wayne Webb

Figures from USGS Fact Sheet FS 2004-3067

Figure 3


Aquatic Biogeochemistry of Nitrogen and Phosphorus: a guide to the wilderness.

The Friends of the Shenandoah River (FOSR) has conducted a monitoring program that now is approaching 25 years in duration.  Nitrogen (N) and phosphorus (P) are among the nutrients whose concentrations are measured: N as ammonia and as nitrate plus nitrite, P as reactive orthophosphate. The purpose of the monitoring is to detect changes in nutrient concentrations that interfere with our uses of the river and to guide management decisions to correct emerging pollution problems in the Shenandoah River and its tributaries and further downstream in Chesapeake Bay.  References to FOSR data in the newsletter almost always center on these data.

Now, more than two decades later, we realize that the choice of N and P as chemical parameters to be measured were common sense choices.  Other chemical measurements might have been chosen to be sure, but shortages of time and money imposed limits.  Despite inevitable limits these were excellent beginnings and the value of the data has increased with time.  The water qualities in the valley are controlled by natural processes involving these nutrients in a complex “wilderness” of interacting processes in aquatic biology, aqueous chemistry, and hydraulic physics.  All of these dynamic processes interact in a geological setting transported from upstream to downstream by flowing waters.  Water is the geomorphic medium of erosion, transport, and deposition. The aqueous chemical reactions take place in water. Water is also a universal solvent of organic and inorganic compounds and the medium in which the aquatic biota live.  Altogether water is a complicated and wonderful wilderness that is both the essential resource for life and the supporting resource for human existence.

The following essay is offered to provide a primer about some of these features of N and P in aquatic ecosystems… sort of a guide to the wilderness.  This may be useful background that will help interpret the monitoring results and design ways to correct pollution insult for the benefit of the Shenandoah Valley.

Some Biological Roles of Nitrogen    A universal feature of living things, both plants and animals, is the presence of nitrogen (as –NH2 ) in amino acids, the building blocks of  structural proteins and enzymes. Photosynthetic plants synthesize amino acids and proteins from CO2 and inorganic nitrogen compounds, ammonia (NH3) or nitrate (NO3).  Just how those forms of carbon and nitrogen are made available is a topic for later, but for now the important fact is that N is an essential component of newly formed protein.  Animals do not synthesize proteins from inorganic nitrogen compounds; they must get them from their food; plants in the case of herbivores, or prey animals, in the case of carnivores.

Some Biological Roles of Phosphorus    Likewise, phosphorus is essentially present in all living things. It is a structural element in DNA and it plays a central role in biochemical reactions that require energy.  The energetic currency of cellular metabolism is adenosine triphosphate (ATP), a phosphorus-rich molecule that is continuously providing energy for living cellular processes.  The details of intracellular P cycling can wait until later. For now search with “google” for the Kahn Academy’s description of the Kreb’s cycle.  Appreciate that phosphorus is essential for life’s energy requiring processes AND it is involved in the transfer of genetic information from generation to generation during reproduction and algal population growth… a result known as an algal “bloom” in cases where nutrient enrichment, or loading, is rapid and widespread.

Roles of N and P in ecosystem interactions.  With that brief account of nitrogen and and phosphorus acting at the cellular level of organization one can see that there must be some emergent or supporting processes at the population level.   For example: if N and P are essential nutrients for growth and reproduction in plant and animal populations: more individuals in a population requires additional N and P.  Appreciate that growth occurs at individual (organism size) AND at population levels (numbers of individuals).  Plants and animals engage in relationships in yet other levels of organization… variously described as trophic structure, food chains, food webs, herbivory, and predation. These are examples of emergent ecosystem processes.  The complexity grows.

Nitrogen and phosphorus may be thought of as chemical tracers of these ecosystem patterns at several levels of complexity even though they serve different biological functions and N in the biomass is 10-15 times more abundant than P.  In summation, when aquatic ecosystems are supplied with nutrients from watershed sources at about the same rate that nutrients are lost to long-term nutrient sinks downstream, then the ecosystem trends toward a stable, dynamic, equilibrium.  The biotic components (species diversity) of the river ecosystem regulate these nutrient cycles and, through time, have adapted to the geologic/climatic processes that govern nutrient cycling.  The condition known colloquially as the “balance of nature” is a dynamic and complex interaction of biological, chemical, and physical “parts”… the total is more than the sum of the parts and change is as common as stability.

Nutrient limitation.  Ecosystem equilibrium is related to the imports and exports of nutrients that have the potential to limit photosynthesis.  This is a classic application of Liebig’s Law of the Minimum: i.e. the factor that limits growth is the factor that is minimally available relative to its demand.  The concept of nutrient limitation in aquatic ecosystems is underpinned by Alfred C. Redfield’s observations in the ocean that the ratio of the common nutrient elements; carbon:nitrogen:phosphorous, to one another in marine organisms approximates 106:16:1 … atom:atom; about the same as the ratio of these elements in the deep ocean.  Redfield’s 1958 article on the control of the ocean’s chemistry by biological processes in the journal, American Scientist, is still a good read.

Carbon, as carbonate, is plentiful in the Earth’s bedrock and many soils… and it is  available from the atmosphere, as CO2, so it is rarely limiting.  Nitrogen and phosphorus were more likely to be available in short supply.  The most common limiting nutrient of plankton algal production in inland lakes is phosphorus (P) and nitrogen (N) is more commonly the limiting nutrient in the ocean or estuaries such as Chesapeake Bay.  There are examples in the literature of algal limitation by silica, in the case of diatom production and by iron in the open ocean.

Plankton populations of algae in rivers and streams are rarely nutrient limited because the rate of downstream transport of algal populations exceeds the rate of population growth… even at base flow, but more certainly at higher velocities in the flow regime.  If, however, the river is shallow enough and the water clear enough for light to penetrate to a stable channel bed then benthic (attached) algae may grow and take up nutrients from the flowing water.   In-stream reaches where sediment in the channel provides for the establishment of beds of submersed aquatic vegetation that may be supplied with nutrients from the flowing water and/or by uptake from the sediments via a root system.  This phenomenon accompanies drought.  Slowing of flow by dams or in pools may also encourage plankton algal responses to higher nutrient concentrations.  We realize that flowing water is at once the medium that transports materials downstream AND it is the geomorphic agent responsible for the changing geometry of the channel through erosion and deposition processes.

Thus, a role of flowing water is the transport of N and P to downstream non-flowing waters (i.e. lakes, impoundments, reservoirs, and estuaries) where they might accumulate and where planktonic algae make up the photosynthetic community… more later about nutrient algal blooms and losses from streams and rivers.

Sources of nitrogen supply and pathways of loss.   Elemental nitrogen (N2) is a gas that makes up 78% of the atmosphere.  Though it is soluble and plentiful in water, N2 cannot enter into the metabolic processes of most plants. Nitrogen is present also in soils as nitrate (NO3), nitrite (NO2) and ammonia (NH3).  All of these forms of N are useable by plankton algae to synthesize amino acids and protein.  The presence in the soil of these useable N compounds is the result of a biological process called nitrogen fixation carried out by bacteria associated with the roots of legumes, such as alfalfa, lupine, peas, and beans.  Among the plankton algae, certain blue-green algae have the capacity to fix elemental nitrogen.  Once fixed as ammonia, amino acids, and proteins, organic nitrogen compounds enter the cycle that supports the growth of plankton algae.  Virtually all N-cycling  reactions are mediated by biological processes.  These include N2 fixation and denitrification losses to the atmosphere.  Note that when adequate phosphorus is available and nitrogen becomes limiting, the plant community often adapts by encouraging N-fixing species (blue-green algae) to enter the community.  This is a self-correcting response at the community level to nutrient limitation. Some of these blue-greens produce toxic compounds and compounds that impose disagreeable tastes and odors to water supplies.  There is no such biological feedback phenomenon accompanying P limitation.   The reduction of NO3 to NO2 to NH3 to N2 is mediated by denitrifying bacteria and may be an important pathway of N loss to the atmosphere.

Sources of phosphorus supply and pathways of loss.   The pre-settlement pristine source of P to water bodies was the soils and the weathering of parent rocks of the watershed.  Phosphorus is present in soils as calcium phosphate, and as polymeric or particulate organic P.   Dissolved P as phosphate (=PO4) is present at low concentrations (say, < 0.05 mg/L) in inland waters, first, because the rate of supply from the watershed is typically low, second, because PO4 is taken up rapidly by planktonic algae, and third, because PO4 has a strong adsorption affinity for suspended clays that settle to the bottom.  Finally, PO4 reacts with ferric iron to form insoluble ferric phosphate, that also settles to the bottom sediments.  These phenomena are such that P loading frequently increases when sediments are being transported.  Most of this happens during the small fraction of the time when flooding occurs and not much occurs at low flows… most of the time.  Atmospheric sources of P are virtually zero and there are no biogenic gaseous P compounds so, unlike N, there are no losses to the atmosphere. 

Effects of N or P limitation at the ecosystem level.  When N and P are available in the water at appropriate concentrations; that is, N:P ~ 10:1-15:1 and import is equal to export, the plant (algal) community tends towards equilibrium and stability.  If the rate of import of either N or P increases, then photosynthesis will respond by increasing the rate of carbon fixation, i.e., the synthesis of organic matter and the consequent growth of algal populations.  The increased rate of algal growth will be maintained until another nutrient becomes limiting.  The biomass may be greater under the new import/export regime having the effect of providing a larger supply of organic matter to the bacterial community.  Oxygen uptake by the bacterial community (aerobic decomposers) increases and dissolved oxygen concentration decreases.  The water in the deeper layers of thermally stratified lakes or estuaries, where O2 exchange with the atmosphere cannot occur and where light is insufficient for photosynthetic oxygen production, becomes depleted in oxygen (hypoxiaàanoxia), the eutrophic condition common in productive lakes.

Without human influence lakes, rivers, reservoirs, and estuaries proceed through a series of stage changes known as succession; natural eutrophication.  The rate at which this happens varies in different geological settings and climates, but on balance it is controlled by the rates of nutrient supply and nutrient cycling.   The time scale of change is on the order of centuries to millennia.

Human induced nutrient enrichment:   With European settlement (since, say, 1607) and development of modern economy using water for domestic supply, agricultural irrigation, power generation, navigation and waste reception (export), more rapid change was imposed and equilibria were disrupted, that is, the system was “unbalanced”.

Water was, at once, valued for many crucial uses and vulnerable to degradation.  Urban sewage (rich in organic N and P) was disposed of by piping it directly into streams and rivers.  When this practice became objectionable, sewage was “treated” by bacterial decomposition.  The effluent decomposition products, now inorganic, were still rich in N and P are still discarded to rivers and streams…by design.  Industrial and agricultural wastes (animal wastes and excess N and P fertilizers) have similar fates with, likewise, similar effects.

An estuarine phenomenon involving P storage in Bay sediments   Note that oxygenated water at depth supports the formation of a thin surface zone of oxidized compounds at the sediment-water interface.  This layer of oxidized compounds acts as a barrier to P diffusion from the deeper anoxic sediments.   Under complete anoxia (E7 < 0.2v) in water overlying this zone, ferric iron (insoluble) is reduced to ferrous iron (soluble), the barrier dissolves, and P is recycled by diffusion from the sediments. This is an internal seasonal process in lakes and estuaries.  It is a mechanism for the storage and release of phosphorus and makes P available that entered the Bay sediments adsorbed to suspended particles from the watershed.   This means that sediments transported to the Bay from the watershed represent a source of P to the plankton community.   Furthermore, it explains why there is a large amount of P in the Bay sediments.  The export of P from the Bay to the ocean is less than the import  of P from the watershed such that the Bay acts as a P trap.  The mass of P that has accumulated in this “trap” since European settlement is probably large enough to supply Bay phytoplankton blooms for decades despite P load-reduction management in the Bay watershed.

The upshot is that water bodies lose utility for human use because the equilibrium of slow change or stability is disrupted and replaced by rapid changes in algal growth (causing objectionable floating scums and taste/odor problems), shifts in species composition to include cyanobacteria that are less valuable as food for grazers and filter-feeders (some are toxic) followed by a cascading sequence of disequilibria throughout the aquatic ecosystem; e.g., a burst of bacterial growth decomposing algal biomass and depleting dissolved oxygen concentration. The onset of anoxia creates reducing conditions that shift many insoluble metal oxides to their soluble species.  Many metals are toxic and have cumulative effects.  These events may trigger redox reactions involving iron in the sediments that change the solubility of P compounds. This releases additional nutrient P that, in concert with newly fixed ammonia, stimulates further algal production in a diabolical example of positive feedback.  Aerobic benthic organisms leave or die… bottom feeding predators are deprived of their food source and leave or starve.  The loss of the ecosystem’s stable equilibrium on short time scales of decades to centuries represents a major disturbance with far-reaching effects that diminish its utility for human uses.

  ~G.R. Marzolf, Winchester, VA

FOSR Report: Risks of biosolid fertilizer application on water quality

karst

A good look at Karst topography

How does nitrogen get in the streams of the Shenandoah Valley?

The water quality data compiled from this FOSR 2013 study in Clarke County, Virginia indicate that springs located near fields or areas where biosolids have been applied have higher Nitrate concentrations than those springs located in areas where biosolids have not been applied.

Download the full report in PDF

This study was conducted by Friends of the Shenandoah River with cooperation of Clarke County and the willingness of landowners who gave access to the springs. Funds for the study were granted to Alison Teetor by the 2013 Citizen Water Quality Monitoring Grant Program, from the Virginia Department of Environmental Quality, and from the Chesapeake Bay Restoration Fund. Chemical analyses were conducted by Karen Andersen and Molly Smith. Ben Sawyer performed GIS measurements and helped with hydrologic analyses. John Young USGS Leetown, WV loaned a stream flow meter. Richard Marzolf helped write this report.

 
Copyright © 2013 Friends of the Shenandoah River