We encourage you to visit our map and data portal that will open with a map identifying all of the FOSR’s monitoring sites throughout the Shenandoah River watershed. You will be able to click on the individual markers that will lead you to a link to obtain FOSR’s water-quality data for that site. The FOSR’s “Water Window” data portal provides unparalleled documentation of the evolving health of the Shenandoah River watershed.
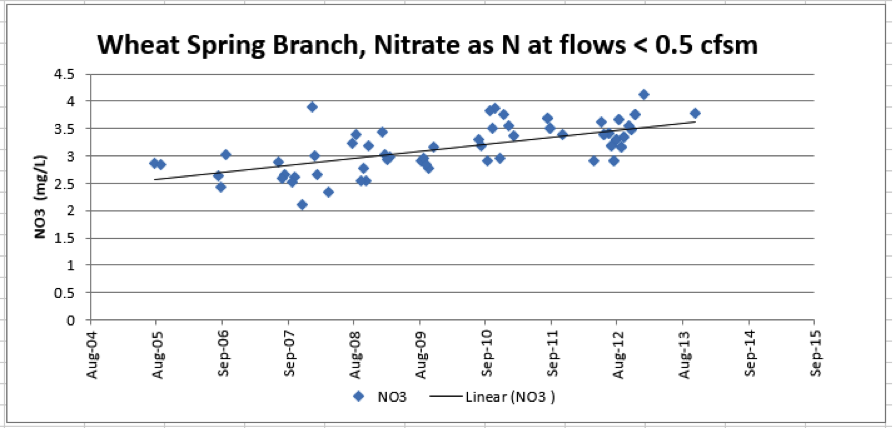
The story from Clarke County is that if the trend in nitrate levels continues, the ground water in the karst areas of the county will contain nitrate concentrations that exceed the US EPA drinking water limit of 10 mg/l of nitrate as N in the latter part of this century or possibly in the next. Most of us in the Shenandoah Valley live in the karst areas and thus, in the future, many of our rural wells could yield water containing high nitrate concentrations. The five streams FOSR has been monitoring for the past 18 years in Clarke County all show increasing low-flow nitrate concentrations of between 0.6 to 1.5 mg/l. (The Wheat Spring Branch record includes only the last 10 years.) a straight line projection of this increase suggests that, if this trend continues, two streams could reach EPA’s drinking water limit of 10 mg/L before 2100: Wheat Spring Branch FC32 and Dog Run FC06. Chapel Run CF18 and Lewis Run FC03 are projected to reach 10 mg/L during 2100 to 2200. Spout Run FC02 and Page Brook FC09, a Spout Run tributary, are increasing more slowly and will not exceed 10mg/l till after 2300.
 Low-flow stream nitrate concentrations are linked to groundwater concentrations. FOSR’s recent analysis of springs showed that in general springs yield water with higher nitrate concentrations than the streams to which they are tributary. For example Carter Hall Spring water contained 3.5 mg/L during a period when Spout Run contained a little less than 2.5 mg/L of nitrate. See www.fosr.org and “FOSR Report: Risks of biosolid fertilizer application on water quality.”
Ground water is the entire water supply of the streams during periods of low flow. (See http://pubs.usgs.gov/sir/2010/5112/ ) The definition of low flow for this report is when the flow of Spout Run at the gage is less than 0.5 cubic feet per second per square mile (cfsm) or 10.6 cubic feet per second (cfs). The gage flow records for USGS 01636316 SPOUT RUN AT RT 621 NEAR MILLWOOD, VA show that the discharge (flow) averaged no more than 0.5 cfsm 23% of the days during the 12-year period of record.
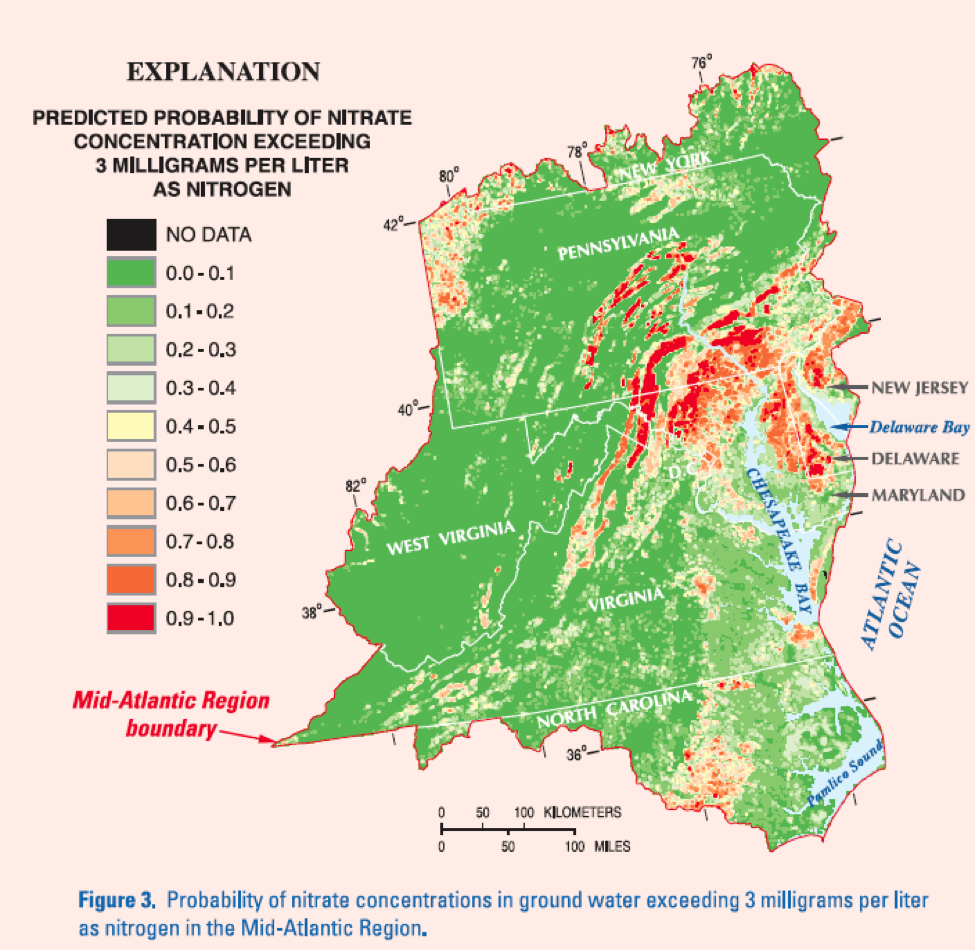
USGS Fact Sheet FS 2004-3067 published in 2005 shows that Clarke County karst areas have a very good chance of having 3 mg/L of nitrate in the ground water and about a 50% chance of having the EPA drinking water limit of 10mg/L in the ground water. Low-flow nitrate concentrations indicate the minimum concentration in the ground water. After water enters the stream, algae use nitrate to grow, thus reducing the nitrate concentrations in the water. It’s possible that animal waste washing into streams could increase nitrate concentration as flow increases. Dog Run, Lewis Run and Wheat Spring Branch increase in nitrate concentration as the flow increases. The other streams decrease in nitrate concentration as flow increases. However, there is no wash off when the flow is 0.5 cfsm or less.
written by Wayne Webb
Figures from USGS Fact Sheet FS 2004-3067